Spatial Autocorrelation
|
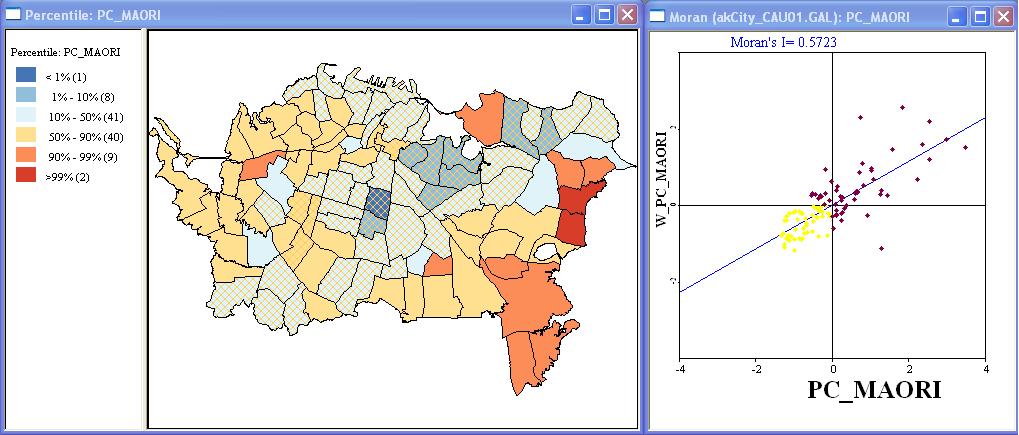
Moran's I AnalysisThe map below shows the a percentile clorpleth of the percentage of Maori population in the City of Aukland by Census Area Units (CAU's). The Moran's I scatterplot to the right shows that the data does show a tendency towards clustering, with a Moran's I greater than zero. The map and scatter plot below have the areas which have a lower percentage of Maori population than the whole, mostly the central and northern parts of the city.
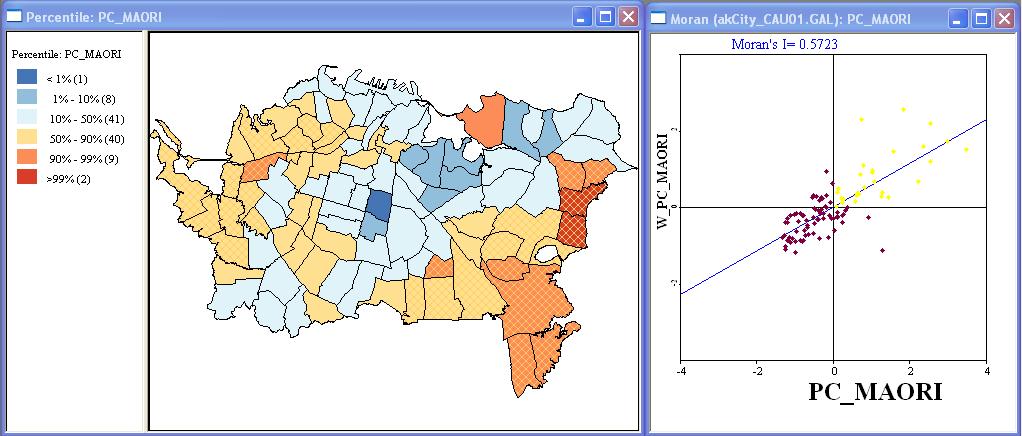
The map below has the area with higher than average Maori population highlighted, two clusters on the east and west sides of the city. Since most of the points in the scatterplot can be found in the upper right and lower left quadrants, this analysis shows a clear tendency towards clustering. Most of the Census Area Units (CAU) fell into these quadrants with the exception of some areas on the edges of these two clusters and with the notable exception of the Orakei North area (the orange CAU on the north side of the City..
|
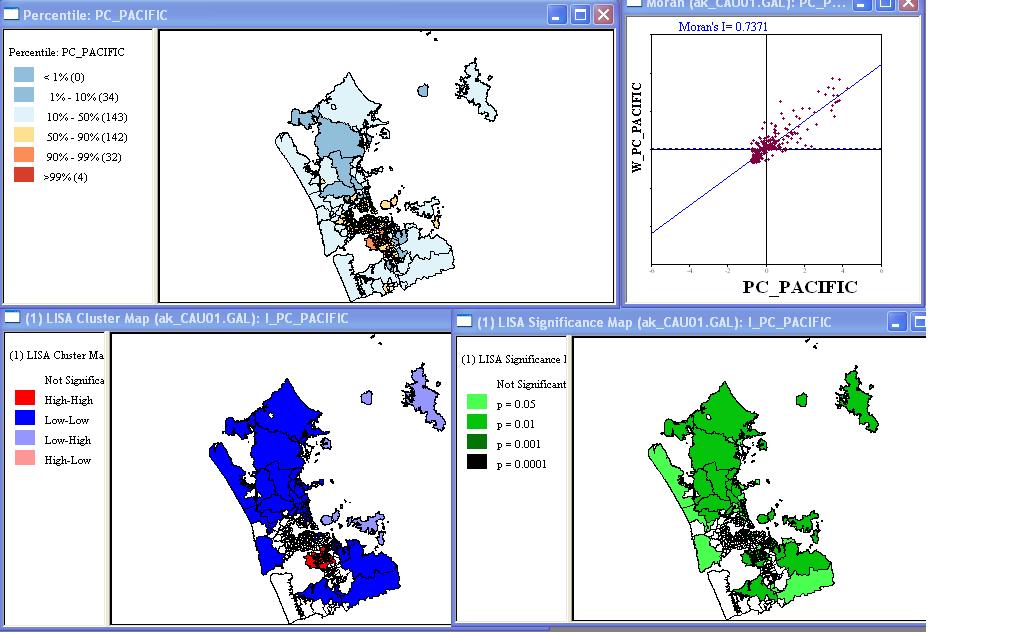
Local Indicators of Spatial Association (LISA) AnalysisA Local Indicators of Spatial Association
(LISA) analysis uses Moran's I and a Monte Carlo simulation to
calculate which CAU's have the greatest conribution to the tendency
towards clustering. The map below show the CAU's for the greater
Aukland area based on percentage of Pacific Islander population.
The percentile map shows a the CAU with the most Pacific
Islanders as a central area of greater Aukland south of the main part
of the City. The Moran's I plot on the right shows strong signs
of clustering (Moran's I = .07371, fairly close to 1) with most points
falling in the upper right and lower left quadrants. The
Clustering map shows the CAU's with the most positive spatial
autocorrellation in red and blue. The Significance map show the
CAU's in dark green which contribute most strongly to the positive
autocorrelation, note that both the areas with strong High-High (red)
and Low-Low (blue) CAU's contribute strongly to the positive
autocorrelation.
|